


By Dale Ford, Chief Analyst, ECIA

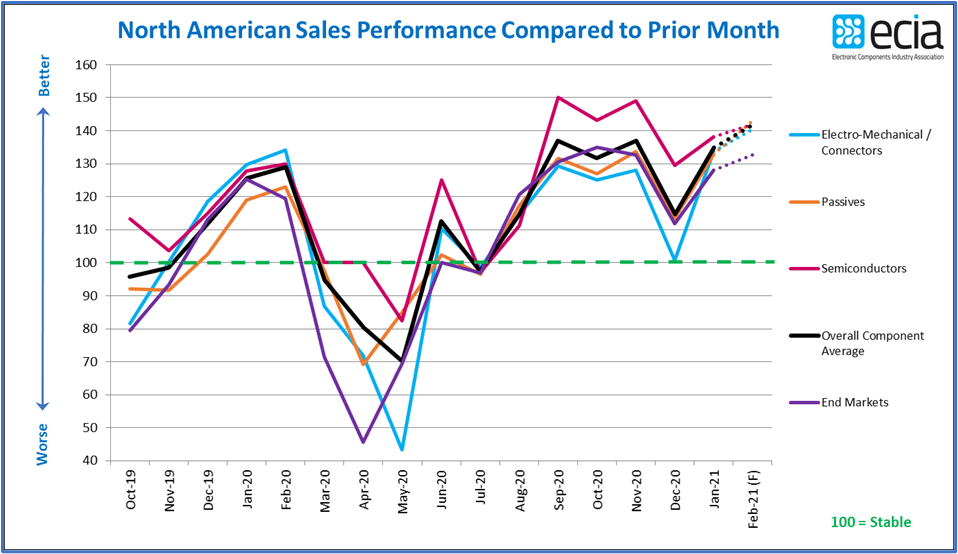
Following a typical monthly slowdown in December 2020, ECIA’s Electronic Component Sales Trend (ECST) monthly survey reveals strong month-to-month growth in January to start 2021 and expectations for even stronger performance in February. Industry executives and analysts had anticipated a strong start to the year and the results in the early stages are validating those expectations. Every component category – semiconductors, passives, and electro-mechanical – saw a strong January rebound following the December lull. The top-level results of ECIA’s recently completed survey are shown in the figure accompanying this article. As a brief explanation, the data presented in this sales index indicate growth when the results are above 100 and declining sales when it registers below 100.
Electro-mechanical/connector components have shown the greatest volatility in sales index measurements in recent months. This category measured a dramatic decline in December followed by a rebound in January that more than offset the December decline. Passive components also saw a strong January boost. Over the past ten months, semiconductors have typically reported the strongest month-to-month growth. So, even though it did not see the same jump in January as other categories, it still recorded the strongest results for January. The relative strength of semiconductor sales performance is seen in the actual sales growth measured by WSTS through November 2020. On a global basis, for the full year 2020 semiconductor sales should grow around 5.5% worldwide and nearly 20% in the Americas region. The good news continues looking forward to February as the sales index is projected to reach its highest level for passive and electro-mechanical components since the start of the survey in October 2019. The index outlook for February shows the forecast for all three component categories grouped tightly together within a range of 2.5 points. The average for overall end market demand lags slightly behind but still shows strong performance in monthly growth.

A review of the detailed monthly sales growth index for electronics components in end-markets shows the Automotive and Industrial markets with the strongest performance in recent months. This is great news for these sectors following an extremely difficult sales environment through most of 2020. In something of a surprise, Mobile Handsets have seen the most weakness among the end markets. However, event the Mobile Handset market index has remained above 100 for the past four months.
The ECST survey also measures results for component lead times and cancellations. Since September 2020, the lead time index for all components has indicated a significant growth in lead times. Given various reports from other sources, this is aligned with the extending lead times experienced by many electronics component procurement groups. Similarly, the index reports a decline in product cancellations over the same time frame, except December, for almost all component categories. If the global economy continues to improve, it appears that electronic component supply will be heavily pressured by market demand in 2021.
There are still many variables that could influence future sales growth. The monthly ECST survey has proven to be a valuable barometer of current sales and helpful predictor of future sales since it was launched in October 2019. It is a complementary companion to the ongoing quarterly ECST survey. The survey has received strong and growing support by electronic component manufacturers, manufacturer reps and distributors and all participants in the electronics component supply chain are encouraged to participate in the surveys. Survey participants receive the complete results of the survey each time they provide inputs.
ECIA members can view detailed results of these monthly surveys in the “North America Electronic Component Sales Trends (ECST)” report in the Stats & Insights section. This report presents data in 43 figures and 172 tables covering current sales expectations, sales outlook, product cancellations and product lead times. The data is presented at a detailed level for six major electronic component categories and eight end markets. Also, survey results are segmented by aggregated responses from manufacturers, distributors, and manufacturer representatives.