


ECIA’s Electronic Component Sales Trend (ECST) June 2023 Survey Results
By Dale Ford, ECIA Chief Analyst
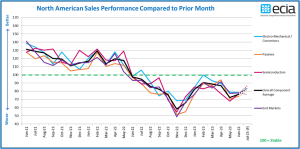
 June sales sentiment for electronic components recovered slightly from a significant drop experienced in the May survey. The overall sales sentiment improved by 4 points between May and June following a 14.5-point plummet between April and May. At 76.3, the June index score is still below the average of the past year. Hope continues to spring eternal as the outlook for the July index improves by nearly 8 points to 84.2.
The primary driver of the improvement in the overall index is the Semiconductor measurement. Semiconductors saw its index score drop by over 9 points in both April and May. The June score rebounded by nearly 9 points and the outlook is for a 10.4-point improvement in July. Passives are also recovering but have a long way to go to recover from the 23.7-point drop in May. The index for Electro-Mechanical components basically remained flat in June but the outlook for July sees improvement of over 5 points.
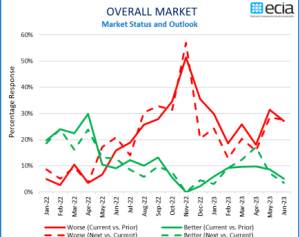
While the July outlook is reasonably hopeful, the experience of a major miss in expectations in the May index counsels caution. The overall trend in index results in 2023 point to an extended market recovery period with a turnaround in year-over-year growth coming at the end of 2023 at the earliest. The major gap in sales sentiment of Manufacturers compared to Distributors and Manufacturer Representatives widened in June and reveals very different views of the market. Distributors and Manufacturer Representatives continue to deliver extremely bearish inputs with overall index scores of 68 and 69 respectively. At the same time, the overall Manufacturer average registered at 99 in June with seven component categories scoring at or above 100. This overall difference of 30 points cannot be ignored.
A review of the survey results reveals that this divergent view of the world started in April. One possible explanation for these extremely different views could be that Manufacturers are seeing stronger performance in their direct business while inventory balancing in the distribution channel continues to weigh on the distribution channel. The overall end-market index was essentially flat between May and June, slightly above the overall component index. However, it loses two points between June and the July outlook while the overall component index improves by roughly 8 points at the same time.
The three end-markets that have had the strongest index numbers, Avionics/Military/Space, Automotive, and Industrial, have all seen weaker results in the June survey. Interestingly, all other markets saw modest improvements in June. However, Avionics/Military/Space, is still the only segment with a score above 100. Automotive dropped back below 100 in June while Medical improved to the mid-90s on the index. Every other segment is in deep red sales sentiment territory. Bottom line – the expectations for sales in 2023 remain the same as the May assessment.
A summary analysis of the ECST results from May, June, and Q2 points to continued downward sales pressure through the first half of the year with the possibility of achieving equilibrium in Q3 ahead of renewed growth hopefully in Q4 2023 or Q1 2024. Product lead time trends in the latest ECST survey show a slight compression in the “stability” reports as both decreasing and increasing lead time results increase. Survey inputs that report stable lead times fell from 53% in May to 47% in June. Comparable increases in both decreasing and increasing lead times were reported. The most significant improvement in lead times was reported for Semiconductors. This is likely due to more fabs coming online to increase supply of semiconductors.
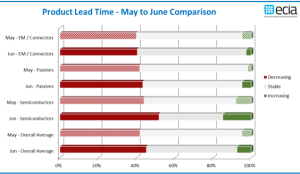
Given the overall assessment that inventory overhang is the greatest challenge facing the supply chain currently, product mix issues would appear to be the main contributor to the jump in increasing lead times for semiconductors as inventories balance out in the declining market. Electro-Mechanical and Passive components continue to see increasing lead time reports at or below 5%.
The ECST survey provides highly valuable and detailed visibility on industry expectations in the near[1]term through the monthly and quarterly surveys. This “immediate” perspective is helpful to participants up and down the electronics components supply chain. In the long-term, ECIA shares in the optimism for the future as the continued introduction and market adoption of exciting innovative technologies should motivate both corporate and consumer demand for next-generation products over the long term. The complete ECIA Electronic Component Sales Trends (ECST) Report is delivered to all ECIA members as well as others who participate in the survey. All participants in the electronics component supply chain are invited and encouraged to participate in the report so they can see the highly valuable insights provided by the ECST report. The return on a small investment of time is enormous! The monthly and quarterly ECST reports present data in detailed tables and figures with multiple perspectives and covering current sales expectations, sales outlook, product cancellations, product decommits and product lead times. The data is presented at a detailed level for six major electronic component categories, six semiconductor subcategories and eight end markets. Also, survey results are segmented by aggregated responses from manufacturers, distributors, and manufacturer representatives.