


As the end of 2023 approaches it is clear that the electronic components sales sentiment has stalled in its attempt to move into positive territory by the end of the year. Following a healthy improvement between May and August 2023, the index has vacillated between 83 and 90 from August through the December forecast.
 The monthly surveys between July and October predicted improvements in the overall index between 94 and 100 for the coming month only to yield disappointing results when the actual sentiment was measured. It appears that a hard reality is setting in with the November survey as the overall outlook for December is measured at 83.3, only a 0.5-point improvement from the November actuals. Efforts to push sales sentiment for electronic components over the 100-threshold indicating positive growth will continue into 2024. The December outlook for sales sentiment in the three major component categories falls in a narrow range between 82.5 and 84.1.
Connectors and Memory ICs report the most favorable outlook. However, the sales sentiment expectations in these strongest segments fall below 90. Between August and October sales sentiment scores for 2 or 3 component subcategories came in between 95 and 102 creating a sense of optimism for more broad-based improvement in the next month.
Unfortunately, no segment could sustain positive momentum. From May 2023 when the overall sales sentiment index began to improve through the December outlook the average overall sales sentiment score was 82.9, roughly equal to the November and December outlook scores. The overall end-market sales sentiment registers slightly above 80 for the November actuals and December outlook. The results from the Q4 2023 ECST survey yield very encouraging results compared to the monthly November survey.
Solid improvement is expected for Q1 2024 with the number of participants reporting expectations of positive sales growth improving from 14% to 23%. A solid share of participants expect growth above 3% in Q1 2024. On the other side, the share of participants reporting negative growth falls from 27% in Q4 to 18% in the Q1 outlook. The greatest share of participants report flat growth in both Q4 and Q1.
The Q4 results compared to the previous Q3 survey were also an improvement as the percent reporting negative expectations fell by 9% while those expecting positive results fell by only 6%. The net score of positive and negative sales sentiment for the Q1 2024 outlook is the most positive since Q2 2022. In a major shift, the chasm in sales sentiment between manufacturer representatives and manufacturers and distributors evaporated in the November survey for both the November actuals and the December outlook.
The manufacturer representatives results showed a dramatic improvement. This is one of the most encouraging developments in the November survey. The chasm had existed for the prior eight months. Given that the manufacturer representatives can be seen as standing on the front lines in the sales efforts their improving outlook gives reason for improved optimism. The overall end-market index reported a minor 1.8-point improvement in November after the collapse it experienced in October. It is expected to stabilize at this level in December.
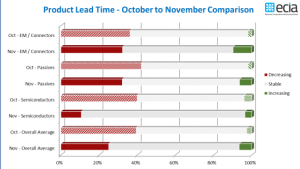
Unsurprisingly, Avionics/Military/Space continues to report very high scores above 100 followed by Medical, Automotive, and Industrial with scores between 87 and 95. Mobile Phones, Consumer Electronics and Computers continue to languish with scores around 70. Every end market category is expected to see softer scores in December except for Computers and Consumer Electronics. Product lead time trends have reversed from the direction they have been going for many months as an overall slight increase in lead times is reported.
|
|
|

|

Survey participants reporting decreasing lead times fell from 39% in October to 25% in November. Increasing lead time reports grew from 3% to 7%. The number reporting increased lead times for DRAM and Flash Memory jumped significantly in November.
While a reduction in the numbers reporting increased lead times has been a positive development after an extended period of extremely high lead times, the growing share of increased lead time reports and shrinking numbers of decreasing lead time reports can be seen as an indicator of improving growth in demand for electronics components.
The ECST survey provides highly valuable and detailed visibility on industry expectations in the near[1]term through the monthly and quarterly surveys. This “immediate” perspective is helpful to participants up and down the electronics components supply chain.
In the long-term, ECIA shares in the optimism for the future as the continued introduction and market adoption of exciting innovative technologies should motivate both corporate and consumer demand for next-generation products over the long term. The complete ECIA Electronic Component Sales Trends (ECST) Report is delivered to all ECIA members as well as others who participate in the survey.
All participants in the electronics component supply chain are invited and encouraged to participate in the report so they can see the highly valuable insights provided by the ECST report. The return on a small investment of time is enormous! The monthly and quarterly ECST reports present data in detailed tables and figures with multiple perspectives and covering current sales expectations, sales outlook, product cancellations, product decommits and product lead times. The data is presented at a detailed level for six major electronic component categories, six semiconductor subcategories and eight end markets. Also, survey results are segmented by aggregated responses from manufacturers, distributors, and manufacturer representatives.