


Back in the early 2000s OEMs were looking for ways to reduce the cost of manufacturing electronics. Nothing wrong with that, of course. But perhaps in retrospect, focusing solely on low cost labor was short sighted, considering how briefly labor rates remain low as a geography gains traction, and how long it takes to establish high quality electronics manufacturing capability in a region.

Even in the early days, there was one consultant who spotted a number of misalignments between the way OEMs calculated manufacturing costs, and the way their EMS partners ran those numbers. Charlie Barnhart developed a thorough methodology for calculating total cost of ownership for OEMs looking to outsource their manufacturing: the Global Pricing Workshop. He helped explained EMS accounting systems to the OEMs so they understood exactly what they were getting for their outsourcing spend. We believe his insights are worth revisiting as once again, companies are rethinking global manufacturing. With even more complex trade relationships on the horizon, it’s important to reconsider the fundamentals of how EMS companies calculate prices and the broader implications of these shifts.
The Global Pricing Model outlined the way total costs should be calculated with this diagram, which formed the foundation of the analysis.
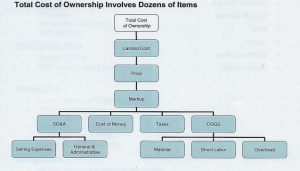
Charlie argued that only focusing on direct labor costs could be detrimental to a company’s bottom line; he cited one example where a large multi-national that moved manufacturing saved $20m USD in COG (primarily as a result of lower labor and related materials costs) but increased logistics costs by $38M. While it’s true that these numbers may represent a small percentage of the total spend, the $18m delta still comes directly out of profits for that company, he explained.
Although dozens of items could be applied to the category of Total Cost of Ownership, the most significant and potentially most expensive are related to just two issues: geographical pros and cons, and the cost of geographical support.
How Geographic Factors Impact the Landed Cost.
Traditionally the items included in the Landed Cost calculations are:
- Product cost (purchase price or F.O.B. value)
- Shipping, insurance, handling fees & surcharges
- Brokers’ fees and commissions
- Customs, Duty, VAT and equivalents (GST)
- Port fees, taxes and charges
- Non-regulatory fees (such as product specific fees and/or intended use fees)
Costs that often get overlooked are:
- Timing of/and exchange rate variations
- Financial planning, execution & control
- Lost opportunity value of the longer cash cycle
- Inventory flexibility and customer service
- After the fact management of cost of goods
- Project or Business Unit specific allocation
- Information systems/Information technology
- Cost of quality relative to initial yields
How significant can these ‘other’ costs be?
Charlie’s methodology was derived from hundreds of case studies of actual outsourcing programs that he painstakingly collected, compared and analyzed. In these case studies he found that the items ‘overlooked’ ranged from 1x to 3x the direct costs associated with the traditionally included categories. The top three recurring items were Financial planning execution and control; Information systems/information technology; and the Cost of quality relative to initial yields.
Material and Labor Elements of Cost of Goods Sold
Cost of Goods Sold (COGS) is the accounting ‘bucket’ where product manufacturing and manufacturing engineering costs are accrued. Unlike the OEM, EMS companies rely heavily on the concept of ‘variances’ in their accounting. Typically, COGS derives from three elements: Material + Labor + Overhead. The version most often used by EMS though adds a fourth element: Variances. In turn, each factor includes a set of sub-factors that are tracked on the Chart of Accounts.
ADD CHART?
All EMS companies include the Bill of Materials in their COGS accounts. However, there is substantial variation from company to company on how they account for non-parts costs such as incoming freight, packaging, planned attrition, etc. Sometimes these costs are retained in the materials chart of accounts and sometimes they are swept into the overhead bucket.
Related, but not generally included in the materials chart of accounts are items such as supply chain management, cost of procurement, supplier quality, other material overhead. Another category of materials-related cost is ‘Other Direct Costs, or ODCs. Because there is no consistency in how these costs are categorized, it is challenging for the OEM to compare apples to apples when considering quotes.
In the EMS industry, labor is divided into two major categories: direct labor (DL) is often referred to as touch, or value- add labor; indirect labor (IL) is often referred to as support or administrative labor. In estimating the labor portion of COGS, only DL is included (i.e. wages paid directly to workers on an hourly basis). Indirect labor is charged to overhead.
Additionally, as humans are not productive every minute they work, a factor is added by time-and-motion analysts. This ‘PFD’ factor (Personal Fatigue Factor) can add anywhere from 5% to 15% to a quote for hours needed. This factor will depend on the EMS company’s practices and how experienced they are with the particular type of product being produced. An EMS company will use a smaller PFD factor for a product they have a good history with, compared to one that is new to them. This is one of the most concrete reasons for OEMs to select and EMS company familiar with their type of product, Charlie explained.
Charlie cautioned attendees at the workshop to not be overly concerned with the exact DL rate because the labor cost is a function of Rate x Time, which is regularly manipulated to present whatever number the EMS company thinks the OEM is looking for. In general, EMS companies all use some version of this process:
- Perform a standard Time and Motion calculation
- Factor this number for yield and other inefficiencies base on experience with similar products
- Multiply these adjusted hours by the EMS’ actual DL rate for that activity in that geography
- Multiple this number by the EMS’ OH rate for that location
Overhead
By far the most complex chart of accounts is for Overhead (OH). Key categories include:
- Employee benefits
- Indirect labor
- Labor training costs
- Equipment amortization
- Facilities cost
- Equipment repair
- Travel and Entertainment
- Labor relations
- Warranty costs
- Social costs
- Taxes and insurance
- Expenses items
- Inspection and audit
- Lost time (facility or line shut downs)
- Scrap charges
- And many other things.
While the relationship between labor and overhead always remains the same (i.e. overhead is absorbed by burdening labor), the proportions change dramatically in different parts of the world. (ADD CHARTS?)
In other words, the composite of the average DL wages, ‘loaded’ with the average OH burden for that geography is the average burdened cost of labor (to the EMS company) in that specific geography. Charlie’s analysis included details about this fact, which are probably no longer valid, but the methodology is still worth following. He pointed out that throughout the world, different skill level workers are paid differing amounts per hour, for example assembly workers vs. technicians. Also, different activities along the product lifecycle require different OH amounts, for example NPI vs. volume production. Even within the same geography, wages and OH vary in different regions, and those rates change rapidly. In other words, it’s complicated.
As OEMs and governments around the globe rethink their electronics manufacturing strategy, this is perhaps the area that will require the most careful analysis. The stark reality is, a labor force with the skills required does not exist in all the regions that are trying to rebuild their manufacturing capabilities. These workers are not interchangeable and must not be taken for granted. Companies have to invest in their people to get a stable workforce capable of building the semiconductors and advanced technology needed.
In other words, chasing the lowest labor rate to reduce costs is now, and always has been, a losing strategy, as Charlie’s careful analysis revealed so clearly. Governments, universities, OEMs, and EMS companies all have to join hands to ensure the industry has the skilled workers needed to be competitive, and they will have to be valued and paid wages that reflect their importance to the success of the industry. Manufacturing and engineering careers must become attractive to a wider swath of the population to rebuild this workforce. This will take decades. Currently too many graduates are mindlessly going into finance to chase the highest salaries. Engineering is too hard and the pay is too low. That must change.
The move toward regionalization – build in the region, for that region – was the approach that Charlie believed made the most sense. We have talked about this before on EMSNOW. In spite of the global disruptions and trade challenges currently anticipated for the near future, this is the most rational endgame. Build products close to customers. That means doing what is best for the long term economic well-being of your workers in the regions where your products are built, which will pay off when those workers want to stay and grow with your company. Companies must take a wider approach to stakeholders: not just company shareholders, but the workers, educational systems, and communities where their factories are located. It isn’t about national borders and corporate profits; it’s about the workers and customers that live in a geography. This represents a substantial strategy shift, especially for the regions trying to rebuild their manufacturing base. Right now, the electronics supply chain is still very interconnected, and no one nation has all the links covered by any means. Global trade policy must be carefully thought out and executed to avoid unintended consequences to these complicated manufacturing ecosystems.
Charlie, sadly, passed away in 2022.
He would probably have a lot of opinions about the trends we are seeing in 2025, and would have been delighted to share them over a beer. We miss him.