


By Dale Ford, ECIA Chief Analyst
 ECIA’s Electronic Component Sales Trend (ECST) July 2023 Survey Results registered an accelerating, refreshing recovery from the doldrums the industry suffered in Q2. Sentiment for overall electronic component sales improved by 6.7 points to reach 83.0 in July. More encouraging, the outlook for August points to a recovery of overall sentiment all the way up to 94.7, the highest level since one year ago in July 2022. However, caution regarding the outlook is prudent given the dashed expectations compared to actual results in recent surveys. Passive components made the largest contribution to the improvement in the overall index with an increase of 10.4 points.
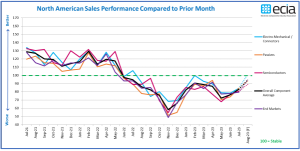
All three component categories achieved improved scores for July. The big winner in the outlook for August is the Electro-Mechanical / Connectors category as it jumps by 17.5 to pass the threshold of 100. Again, caution should be exercised in this outlook since this category had been forecast to break above 100 before and fell far short. The individual category scores range from 80.6 to 84.3 in July with Electro-Mechanical on top. The improvement and gap between top and bottom grows significantly in August with a range of 89.2 to 101.7. Semiconductors sees the weakest outlook for August. Hopefully the industry has moved past the double dip in sentiment it experienced over the past year. If the market can sustain recent improvements, it is possible that sales sentiment for all categories could top 100 in Q4 which would signal a return to broad-based growth. This maintains the expectation of a turnaround in year-over-year
growth coming at the end of 2023 at the earliest.
 In recent months a major gap developed in sales sentiment of Manufacturers compared to Distributors and Manufacturer Representatives. A comparison of these groups showed a growing difference between April and June. The sentiment scores revealed a highly divergent view of the world with Manufacturers much more positive compared to the others. Manufacturer Representatives were very negative in their view of the market. One possible explanation for these extremely different views could be that Manufacturers were seeing stronger performance in their direct business while inventory balancing in the distribution channel continued to weigh on the distribution channel. In an encouraging development the overall difference between Manufacturers and Distributors narrowed substantially in July and the Distributor view improves above Manufacturers in the August outlook. There are notable differences in the subcategories, but the overall view converges. Manufacturer Representatives see an increase in the size of the gap compared to the others in July. However, the August outlook brings all
three groups into much closer alignment with the Manufacturer Representatives’ overall scores registering between the Manufacturers and Distributors. This converging outlook is a very positive indicator as it could indicate the distribution channel is resolving inventory imbalances and responding more in line with end market demand.
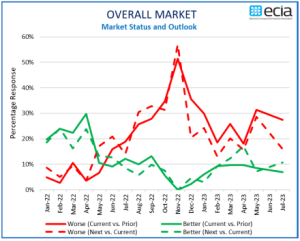
The overall end-market index has been essentially stable between 77.1 and 79.5 between May and July. In a very encouraging development, the overall market index jumps by 15.2 points in the August outlook. This optimistic outlook is seen across all end markets with every market reporting an improving sales sentiment looking toward August with the exception of Avionics/Military/Space which already scores well above 100. August expectations have Automotive Electronics, Industrial Electronics, and Medical Electronics all passing the 100-threshold indicating growth. The lowest score is reported by Computer with an index score of 82.7 in August. However, this is a jump of nearly 48 points from its depressing low of 34.8 in November.
Overall, the July survey delivers encouraging news with solid indications that the market environment is improving in the second half of 2023. In the analysis last month, it was hoped that sales equilibrium could be achieved in Q3 leading to renewed growth in Q4 2023 or Q1 2024. The July results strengthens this expectation and increases the chances of a return to sales growth being pulled in to Q4 2023.
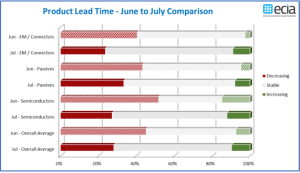
In a development that aligns with improving market demand, Product Lead Time trends in the latest ECST survey report a large increase in reports of “stability” with over half reporting a stable lead times. In addition, every market reports a deep drop in those reporting decreasing lead times with slightly higher levels of increasing lead times. If we are indeed in the process of seeing improved sales as indicated in the product and market index results, this shift in lead time sentiment would be expected.
These results reinforce the improving outlook as we move through the second half of 2023. Bottom line – all indicators point to July representing a significant upward turning point in sales expectations.
The ECST survey provides highly valuable and detailed visibility on industry expectations in the nearterm through the monthly and quarterly surveys. This “immediate” perspective is helpful to participants up and down the electronics components supply chain. In the long-term, ECIA shares in the optimism for the future as the continued introduction and market adoption of exciting innovative technologies should motivate both corporate and consumer demand for next-generation products over the long term.