


By Dieter Weiss, in4ma

When in4ma started to analyze the market independent of any association five years ago, the objective was to finally get to real numbers rather than numbers and statements about the EMS industry that were obviously wrong. With primary analysis, in4ma was able to establish a clear picture about the European EMS industry.
As of January 2020 José Luis Haghenbeck Cabrera will join the in4ma team, allowing us to dig deeper and expand our primary research of the EMS/ODM market.
We already started by crosschecking the List of the global TOP 50 EMS/ODM manufacturers. We have analyzed the TOP 20 in detail and the outcome was a surprise. Different to the list that has been flying around in the industry recently, we realized that several big companies had been missing. The Top 10 have a global market share of 54% (calculated in USD).
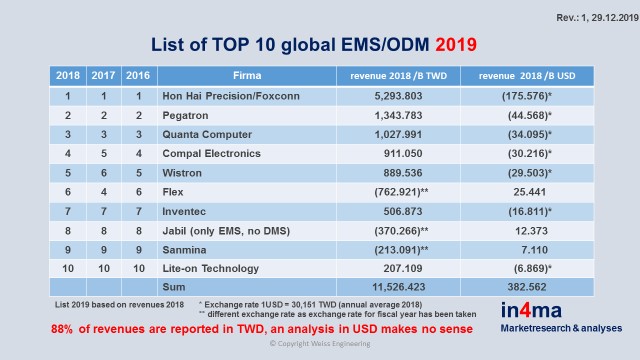
Here is the List of the TOP 10 EMS/ODM with 2018 revenues:

Looking at the TOP 50 we analyzed that 79% of revenues of them are originally in TWD (Taiwan), only 14% are in USD, 2.3% in RMB (China), 1.3% in Euro, 1.2% in JPY (Japan) and 1.6% are in six other currencies. The question has to be raised, whether it makes sense to track the annual development of the global EMS industry in USD.
The answer is a clear no. Looking at the changes of the exchange rates between USD and TWD it becomes clear, that a growth rate calculated in USD does not show the real picture but is heavily influenced by the volatility of the USD.
Let us show this with the list of the TOP 10 in more detail. Seven of ten companies (88% of TOP 10 revenues) are reporting their numbers in TWD, not in USD. Why are we then translating the TDW numbers in USD, which make them more inaccurate as they include a fluctuating exchange rate? A very good question, showing the growth rates in TWD rather than USD would give a much better picture about the growth of the EMS/ODM market.
Even better is to use a weighted growth rate reflecting the percentage of revenues in TWD and the percentage of revenues in USD.

Now one might argue that such analysis is rather late as we are approaching 2020 already. What is an analysis worth, which includes 2019 already that is published five days before the end of the year? As all these companies are public companies, no analyst will get any revenue information upfront, as this is illegal. This means as well, that such information contains a lot of speculation and gossip. We at in4ma prefer unpleasant truth rather than comfortable lies.
A new list of the TOP 50 EMS/ODM is under work, it will have many negative surprises for the majority of companies on the old TOP 50 list, which then market knows today. You are cordially invited to crosscheck the in4ma list, for that reason the 2018 numbers were given in the chart. All in4ma numbers can easily be explained, only people with no real data will tell you they have “hard facts”.
You want to know more? Visit me at SMTconnect in Nuremberg/Germany May 5-7, 2020, the place which is developing to the leading EMS exhibition to all people, who realized that it is the highest time to do something about marketing their services and the strength of their business.